The Alliance

Insight Series

The Alliance insight series offers critical resources for stakeholders across the donation and transplantation continuum. For each topic, you can find related action items, tools, and references.

RESOURCE MATERIALS

January 2024 TX Quality Corner Editing Final Page 1

The Alliance Insight Series

Feedback & Suggestions Welcome

Your input is valuable to us as it helps improve our programs and offerings in order to provide you with vital updates and essential information. Please feel free to share your thoughts and ideas with us.

TxQualityCorner Logo Blue

JANUARY 2024

Jan2024 Promo Artboard Header

Executive Summary

In December 2021, the OPTN Board of Directors approved new metrics for monitoring the performance of transplant programs, including pre-transplant mortality. This document provides a summary of education on the new pre-transplant mortality metric, tools to understand current performance and action items for transplant centers to implement.

Screenshot 2024 02 01 At 10.01.50 AM

Action

How can transplant centers improve their pre-transplant mortality hazard ratio?

Screenshot 2024 02 01 At 10.11.30 AM

Education

Background

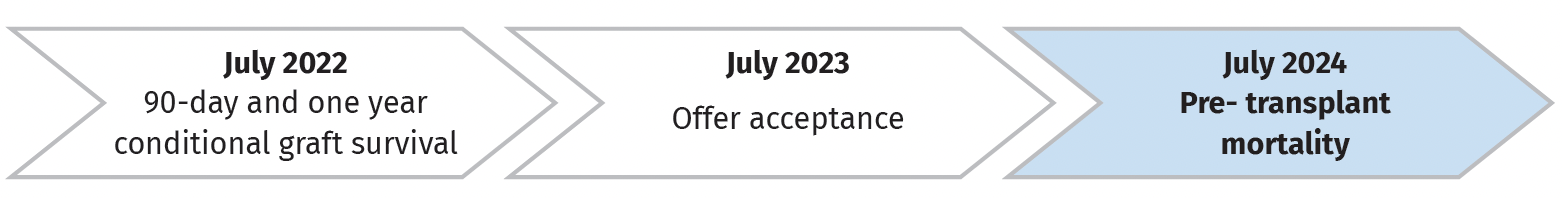
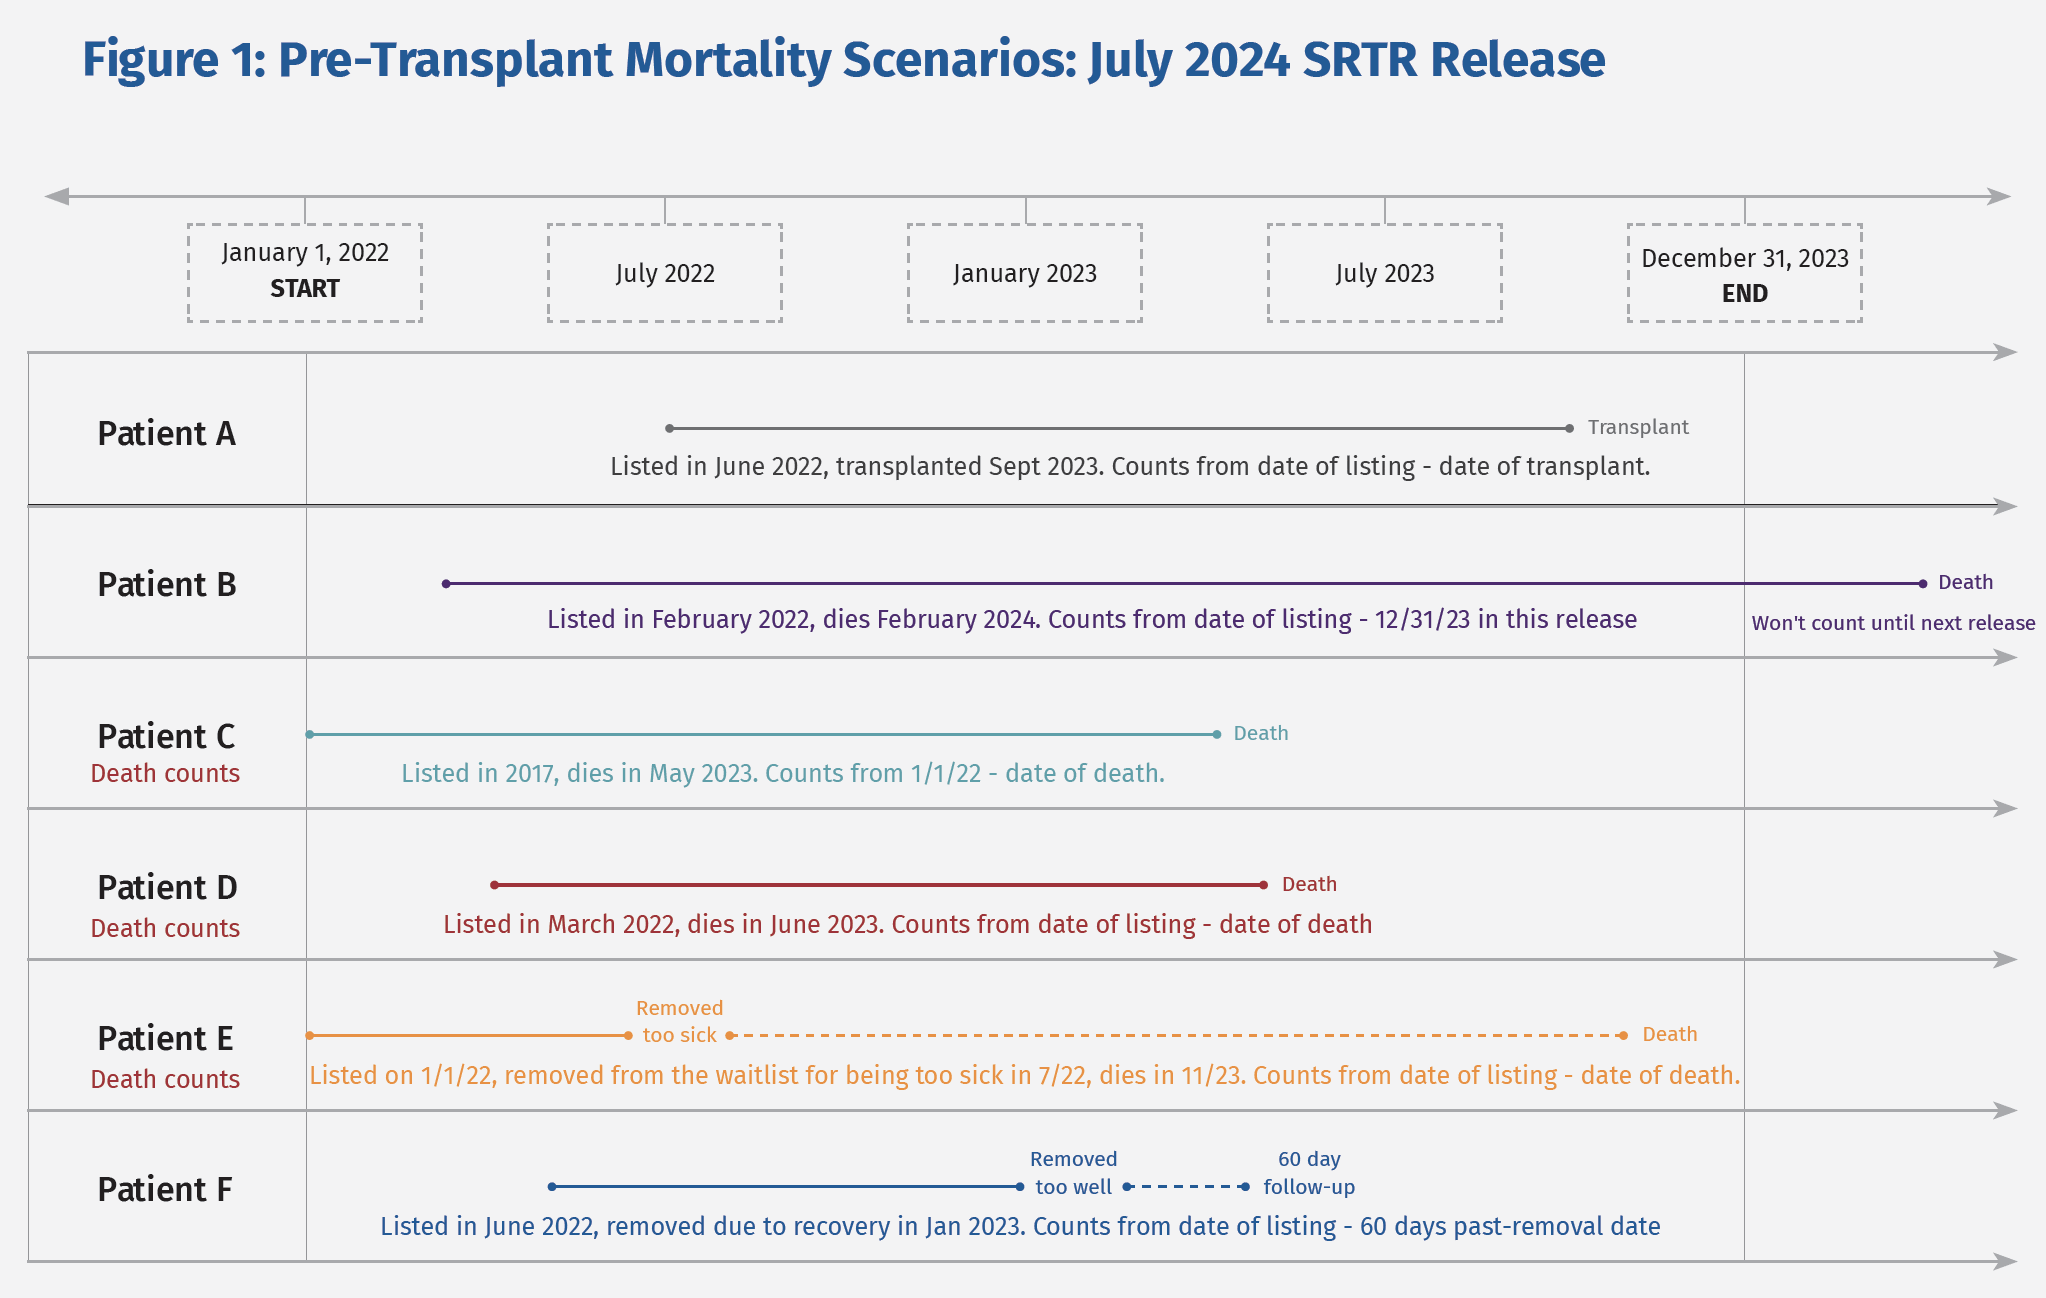
Historically, the OPTN Membership and Professional Standards Committee (MPSC) only focused on measuring performance in the post-transplant period. The new metrics encompass the entire patient care experience. These new metrics include 90-day and one-year conditional graft survival (released July 2022), offer acceptance (July 2023), and pre-transplant mortality (expected to be released in July 2024). Pre-transplant mortality compares a transplant program’s observed pre-transplant mortality rate to its expected pre-transplant mortality rate using a rolling 24-month cohort. Any patient who was listed and alive for at least one day before the end of the 24-month period is included.

Previously, all waitlist removals were tracked for 60 days post-removal; any death after that point was not counted. With the new pre-transplant mortality metric, candidates are tracked for the entire two-year cohort period, with only a few exceptions:

  • Transplanted
  • Transferred to another center
  • Removal for recovery – these candidates are still tracked for 60 days post-removal but then are excluded
Screenshot 2024 02 01 At 10.14.53 AM
Screenshot 2024 02 01 At 10.17.48 AM

*What is “person years” and how is it calculated?
Person years considers the total number of candidates and the total number of days that each candidate is observed on a waitlist during the two-year cohort. When calculating, the total number of days each candidate was alive on the waiting list is converted into a fraction of a year, and then all fractional years for each candidate are added together to equal total person years.

Screenshot 2024 02 01 At 10.20.02 AM
Screenshot 2024 02 07 At 11.54.24 AM

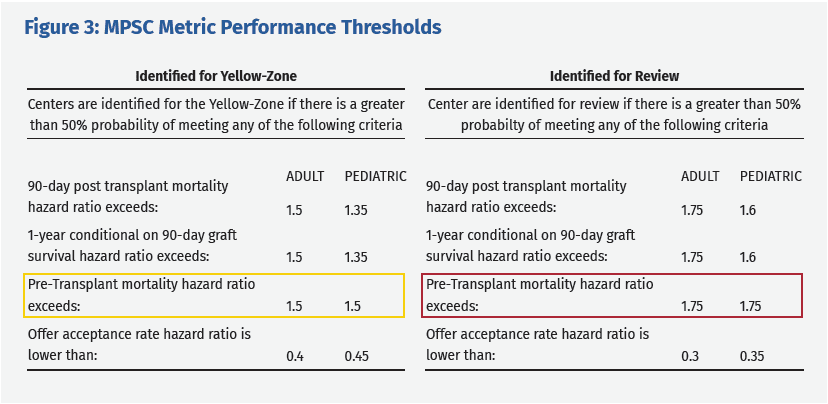
To monitor transplant centers’ performance, the MPSC developed performance thresholds for each of the new metrics.

“Identified for yellow-zone” indicates a program is in an area of performance improvement, and that program will receive a notice of this as well as an offer of assistance through OPTN individual Member Focused Improvement (IMFI) group.

“Identified for review” indicates a program is identified for mandatory MPSC inquiry. Centers are flagged if there is a greater than 50% probability of meeting the hazard ratio criteria.

Screenshot 2024 02 01 At 10.24.19 AM

How do I know how my center is currently doing?

  1. NEW MPSC Pre-Transplant Review Criteria document (Figure 2) – released every 6 months with SRTR PSR Reports. The interval being reviewed for pre-transplant mortality is a rolling two-year period and changes with each SRTR release. Adult and pediatric pre-transplant mortality practices are reported separately.
  2. SRTR PSR Reports (Figure 4) – released every 6 months. The time being evaluated is a rolling two-year period and changes with each SRTR release. Adult and pediatric pre-transplant mortality practices are reported separately with a combined hazard ratio.

    a. Table B5: Pre-transplant mortality rates, Figure B4: Observed and expected pre-transplant mortality rates, Figure B5: Pre-transplant mortality rate ratio estimate, and Figure B6: Observed adult (18+) and pediatric (<18) pre-transplant mortality rates.

Tools & Resources

What tools are available to assist in improving pre-transplant mortality?

  • Secure SRTR website
    • Waitlist expected worksheet
      • Includes all granular data that was published in the latest SRTR release
      • Provides worksheets to look at subsets of your transplant center’s waitlist population to determine waitlist mortality rate ratio
  • OPTN
    • In the second half of 2024, pre-transplant mortality data will be added to the MPSC Transplant Metrics Dashboard found in the OPTN Visual Analytics section of the Data Services portal. This will allow users to explore how subgroups impact their performance with this metric.
    • Available in the OPTN Data Files section of the Data Services portal is a “Report of Deaths on the Waiting List”
      • One report per organ type (Kidney, Liver, Heart, etc.)
      • Includes 1) patients removed from the waitlist for reason of death 2) patients removed from the waitlist for a reason other than transplant and identified as a death from an external data source and 3) patients still on the waitlist and identified as a death from an external data source.
      • Details such as date of removal and date of death included in the report.
  • UNOS
    • A new forecasting tool for transplant hospitals related to performance metrics coming in spring 2024.
      • Initial release will include both post-transplant outcomes and pre-transplant mortality.
      • Tool allows user to look forward several cohorts so programs can more easily track their progress with these metrics prior to release of reports.

Additional Resources

How to access risk adjustment factors from the SRTR public website:

  • Go to public SRTR website (www.srtr.org)
  • Tools ⇨ Risk Adjustment Models ⇨ Waiting List ⇨ Pre-transplant Mortality Rate (previously labeled waitlist mortality rate)
  • Choose organ of interest and age group ⇨ click on “Model Coefficients” tab and then download .csv file. This will show you which factors are risk adjusted for the candidate, as well as the impact of each factor.

How to see reported pre-transplant mortality programmatic information on SRTR secure website:

A SPECIAL THANKS TO THIS ISSUE’S CONTRIBUTORS

We would like to express our sincerest gratitude for our contributors’ tireless efforts on making Transplant Quality Corner a reality. Their dedication and expertise have been an invaluable contribution to the successful launch of this project. We are incredibly grateful for all their hard work and commitment.

Ff 411e6473548292436c685ca01b1747bc Ff Alicia
Alicia House
RN, BSN, CPTCTransplant Quality CoordinatorSt. Louis Children's Hospital
Lindsey Shinn Profile Picture
Lindsey Shinn
MSN, RNAbdominal Transplant Program ManagerSt. Louis Children's Hospital
Sarah Taranto
Sarah Taranto
Transplant Analytics Service Line Leader United Network for Organ Sharing (UNOS)

A SPECIAL THANKS TO THE TRANSPLANT QUALITY CORNER WORKGROUP

Deepa Kurup
Deepa Kurup
RN, MSN, MBA, CPHQ, LSSBBQuality Manager, Center for Transplantation UC San Diego Health System
Be203ac2ecb9dfdfee91b13682e8260f
Melissa Robinson
Quality & Safety Director, Transplant Institute Loma Linda University Medical Center
Jenna Lawson
Jenna Lawson
MSAbdominal Transplant Quality ConsultantVanderbilt University Medical Center
Hellen Oduor Headshot
Hellen Oduor
Quality ManagerMethodist Dallas Medical Center
Randall Sung
Randall Sung
MDProfessor of SurgeryUniversity of Michigan
Headshot
Lindsay Smith
RN, MSNTransplant Quality DirectorVanderbilt Transplant Center

FEEDBACK

If there is content you feel that should be added or was lacking, we would like to hear from you. Positive feedback on what is working for you, is also welcomed. Thank you for taking the time to provide us with your feedback.

Insights Feedback Form